
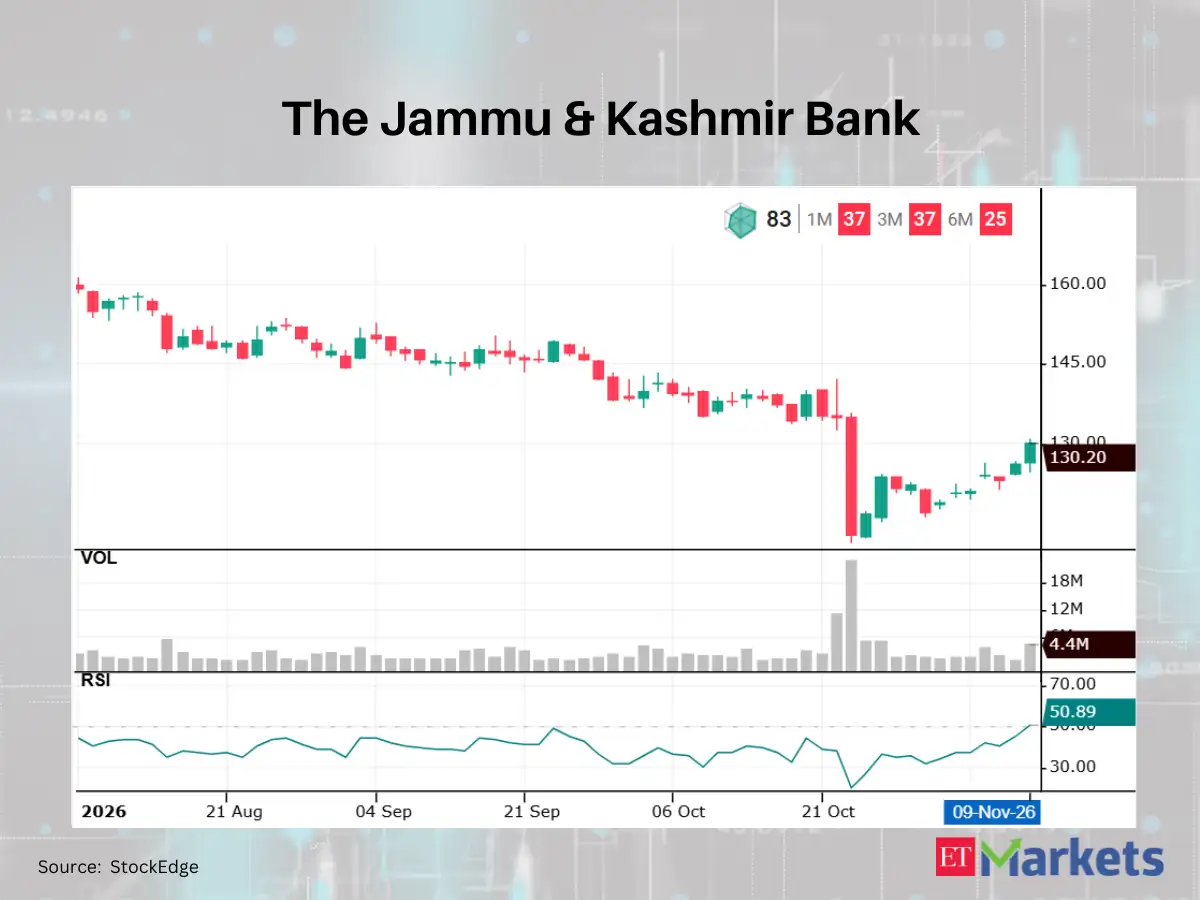
On November 9, stock market technical analysis identified Bharat Dynamics as one of five Nifty500 constituents featured prominently in StockEdge’s technical scan titled RSI Trending Up. Each of the five selected equities recorded price gains exceeding 3% during the trading session. This notable price movement highlights strong buying activity, active trading, and positive session performance across these specific listed corporate entities within the broader Nifty500 index framework.
The technical scan specifically evaluated the Relative Strength Index, commonly known as RSI, identifying instances where this key indicator successfully crossed above the benchmark level of 50 from below. In standard technical analysis, an RSI movement crossing above the 50 threshold serves as a pivotal signal indicating that underlying price momentum is actively strengthening, signaling a positive shift in technical sentiment for the stocks involved.
The combination of a single-day price gain exceeding 3% alongside a Relative Strength Index crossover above 50 points to significant technical momentum building behind Bharat Dynamics and four other index constituents. Market observers and active traders utilize automated tools like StockEdge to systematically monitor these technical indicators, track short-term price strength, and assess overall price trends across prominent Indian market equities.

